It’s simple to become confused by buzzwords, jargon, and methodologies when stepping into the world of business strategy and performance tracking. Objectives and Key Results, or OKRs, is one such methodology that has experienced significant growth in the corporate world. This framework’s key component is the separation of “OKR outcomes” and “OKR outputs.” This distinction is important for assessing an organization’s actual progress and is not just a play on words. We will clarify the distinction between “OKR outcome vs. output” in this blog post and highlight why it is so crucial for businesses in the modern world
Table of Contents
Understanding Outputs and Outcomes Definition
Outputs and outcomes are critical concepts in the realm of planning, project management, and evaluation, especially in fields like public health, education, and business. At first glance, these terms may seem synonymous, but they represent distinct stages in the trajectory of a project or program. Understanding their differences can be crucial for designing effective strategies and assessing real-world impacts.
Definition
- Outputs refer to the immediate, tangible products or deliverables resulting from an activity or set of activities. They are often quantifiable and are the direct results of specific actions taken.
- Outcomes represent the changes or benefits that occur after participating in an activity or program. They describe the impact of the outputs on broader objectives. Outcomes can be short-term, intermediate, or long-term.
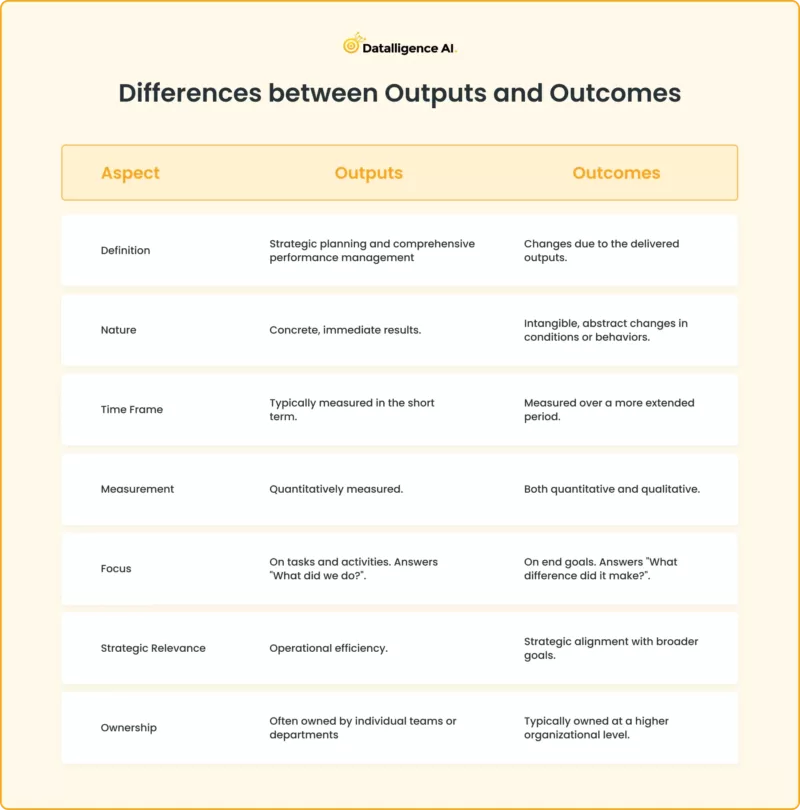
Differences between Outputs and Outcomes
In the OKR framework, distinguishing between “OKR output” and “OKR outcome” is vital. “OKR output” emphasizes tangible deliverables and completion, like product manufacturing counts or seminar frequencies.
Conversely, “OKR outcome” evaluates the deeper impact of those deliverables. It’s about broader goals, such as how the market reacts to products or the knowledge enhancement from seminars.
Comparing “OKR outcome vs. output” highlights a key difference: outputs focus on ‘doing,’ while outcomes are about ‘achieving.’ This balance ensures productivity is paired with purposeful progress.
Balancing Outputs and Outcomes with OKRs: Finding the Right Mix
To balance outputs and outcomes with OKRs, focus on outputs that support the achievement of your outcomes. Ask yourself: “How will this output contribute to achieving our desired outcome?” If the output does not contribute to the outcome, reconsider the output or the outcome.
Strategies for Balancing Outputs and Outcomes
- Define Clear Objectives: Start with specific objectives tied to organizational goals.
- Prioritize Key Results: Choose results measuring the impact of outputs, e.g., “Increase customer satisfaction by 15 points.”
- Use Leading and Lagging Indicators: Combine predictive metrics (leading indicators) with outcome measurements (lagging indicators).
- Regularly Review and Adjust: Frequent OKR reviews allow mid-cycle adjustments for ongoing progress.

Aligning OKRs with Organizational Goals
- Start with Strategic Planning: Ensure OKRs align with the organization’s strategic plan and initiatives.
- Cascade OKRs: Break high-level objectives into departmental or team-level OKRs for alignment.
- Foster Collaboration: Encourage cross-functional collaboration to leverage strengths across teams and balance outputs and outcomes.
Tools and Methods for Measuring Outcomes

- Surveys and Feedback: Gather stakeholder input to assess the impact of outputs.
- NPS Surveys: Measure customer loyalty and satisfaction with NPS surveys.
- Social Media Metrics: Analyze shares, comments, and sentiment for social media campaigns.
- Sales Data: Assess revenue growth and customer acquisition to gauge marketing outcomes.
- Qualitative Interviews: Conduct interviews for in-depth insights into impact.
- Before-and-After Comparisons: Compare data before and after changes to measure impact.
- ROI Calculations: Calculate ROI for financial impact assessment.
- Balanced Scorecard: Implement a balanced scorecard framework for comprehensive outcome evaluation.
Examples of output-focused OKRs
Marketing Department
Enhancing digital visibility is crucial to capture our target audience and differentiate ourselves from competitors. Objective: Achieve a 25% increase in online brand engagement by Q3.
- KR1: Successfully initiated 3 new online ad campaigns aimed at our core demographics before Q2 ends.
- KR2: Secure partnerships with at least 5 leading influencers to endorse our product within Q2.
- KR3: Increase website and social media content output by 25%, translating to 40 new pieces by Q3.
Sales Department
Efficient sales processes translate directly to improved revenue growth and customer satisfaction.
Objective: Achieve a 15% increase in sales efficiency through optimized processes by Q3.
- KR1: Fully transition to a new CRM system with 100% of sales staff trained and using it by month’s end.
- KR2: Ensure 100% of sales staff attend bi-weekly product update training for the upcoming quarter.
- KR3: Equip 100% of sales representatives with a new, enhanced product pitch deck within 6 weeks.
Human Resources Department
A robust onboarding process is pivotal in ensuring employees integrate seamlessly, boosting retention and productivity.
Objective: Achieve a 90% satisfaction rate in the new employee onboarding process by Q3.
- KR1: Disseminate the revamped onboarding manual to 100% of new hires starting Q2.
- KR2: Schedule and conduct bi-monthly orientation programs for all new hires in Q2 and Q3.
- KR3: Ensure 100% of new hires are paired with department mentors within their first 7 days.
Product Development Department
Our product’s relevance and utility hinge on our responsiveness to user needs and feedback.
Objective: Incorporate user feedback and achieve a 10% improvement in product functionality by Q4.
- KR1: Obtain, analyze, and categorize actionable feedback from a minimum of 300 unique users in the next 60 days.
- KR2: Develop, test, and refine the top two most-requested features by Q3 end.
- KR3: Launch these features in a beta phase to a test group of at least 100 users for feedback by Q4.
Customer Service Department
Delivering timely support enhances customer trust and loyalty, reinforcing our brand’s commitment to excellence.
Objective: Reduce average customer response time by 20% by Q3 end.
- KR1: Successfully transitioned to a new ticketing system that streamlines query response by the close of Q1.
- KR2: Augment the customer service team with 5 trained representatives in 60 days.
- KR3: Introduce a chatbot service by Q3 end, targeting a 15% reduction in manual ticket generation.
Real-world examples of outcome-driven OKRs
Marketing Department
intending to strengthen our brand’s appeal, our marketing team aspires to cultivate deeper customer relationships.
Objective: Increase Brand Loyalty and Engagement.
- KR1: Achieve a 20% increase in repeat purchases from existing customers by Q3.
- KR2: Elevate the Net Promoter Score (NPS) by 10 points by the end of the year.
- KR3: Boost social media engagement rates (likes, shares, comments) by 25% over the next two quarters.
Sales Department
Driven to foster trust and value, our sales team aims for richer client partnerships.
Objective: Enhance Client Retention and Satisfaction.
- KR1: Reduce client churn rate by 15% over the next six months.
- KR2: Achieve a 90% satisfaction rate in post-sales client surveys by Q4.
- KR3: Upsell or cross-sell to 30% of existing clients in the next two quarters
Human Resources Department
In the pursuit of a thriving work environment, our HR team focuses on enhancing employee well-being and growth.
Objective: Elevate Employee Satisfaction and Growth.
- KR1: Achieve a 20% increase in positive responses in the annual employee satisfaction survey.
- KR2: Reduce employee turnover rate by 10% by the end of the year.
- KR3: Ensure 70% of employees participate in at least one professional development activity each quarter.
Product Development Department
Centered on user-centric design, our product team is determined to deliver solutions that resonate with our users’ needs.
Objective: Improve User Experience and Product Utility.
- KR1: Decrease the number of user-reported issues by 30% over the next two product releases.
- KR2: Achieve a user satisfaction rate of 85% or above for the new feature rollouts by Q3.
- KR3: Ensure that 40% of users adopt the newly introduced product features within three months of launch.
Customer Service Department
With an unwavering commitment to serve, our customer service team seeks to resolve concerns with empathy and efficiency.
Objective: Strengthen Customer Trust and Resolution.
- KR1: Reduce the average resolution time for customer queries by 25% in the next quarter.
- KR2: Achieve a 95% customer satisfaction rate on resolved issues by the end of Q2.
- KR3: Ensure that 80% of customers report feeling “highly supported” in post-interaction surveys throughout the year.
OKR Outcomes and Outputs in Harmony.
In conclusion, within Datalligence, a clear understanding of OKR outcomes vs. outputs is pivotal. Aligning objectives with meaningful outcomes, such as enhanced customer satisfaction, while ensuring efficient outputs like UI redesigns, empowers the organization to excel in its mission-driven pursuits. OKRs, when balanced effectively, drive Datalligence’s success. Talk to our experts and coaches and gain more insights.