In today’s fast-paced and highly competitive business landscape, SaaS (Software as a Service) companies are constantly striving to deliver exceptional products that meet the evolving needs of their customers. To succeed in this dynamic environment, SaaS product teams must measure their progress effectively and align their efforts with strategic objectives. A KPI metrics value that demonstrates how effectively an individual, team, department, or organization is achieving its objectives and targets.
KPI metrics are used to evaluate performance and provide a clear understanding of progress towards specific goals. They serve as important metrics to track and assess performance, enabling informed decision-making and strategic planning.
But how do you choose the KPIs or metrics that matter?
We understand that navigating the vast landscape of KPIs can be overwhelming. That’s why we have curated this comprehensive list of 50 KPIs, categorized under various key focus areas, to help you prioritize what matters most for your SaaS product.
So let’s embark on this journey together and discover the essential KPI metrics that will help you unlock the full potential of your SaaS product. What is the Importance of Key Performance Indicators (KPIs) in SaaS product teams
By tracking KPIs, SaaS product teams can gain valuable insights into user behavior, product usage, customer satisfaction, and business growth, which ultimately leads to improved product development and customer success.
The importance of KPIs in SaaS product teams can be highlighted in several ways
Performance Evaluation
KPIs enable product teams to evaluate their SaaS product’s performance against predefined benchmarks and goals. By measuring key metrics such as user adoption rates, customer satisfaction scores, and revenue growth, teams can assess whether their product is meeting expectations and making progress toward desired outcomes.
Product Enhancement
KPI metrics provide insights into areas where product improvements are needed. By analyzing metrics like customer churn rate, average revenue per user, and feature usage data, SaaS product teams can identify pain points, prioritize enhancements, and optimize their product roadmap to align with customer needs and market trends.
Customer Success
KPI metrics related to customer success metrics, such as customer retention rate, onboarding completion rate, and customer support response time, help product teams gauge the overall satisfaction and success of their customers. Monitoring these KPIs enables teams to proactively address customer concerns, optimize user experiences, and foster long-term relationships with customers.
Data-Driven Decision-Making
KPI metrics provide objective data that drive informed decision-making. By analyzing KPI trends and patterns, SaaS product teams can identify opportunities for innovation, allocate resources effectively, and prioritize initiatives that will have the greatest impact on business outcomes. KPIs also help teams justify investments and demonstrate the value of their product to stakeholders.
Goal Alignment
KPI metrics serve as a means to align product teams with broader business goals and objectives. By defining and tracking KPIs that align with the company’s strategic objectives, teams can ensure that their efforts are focused on activities that drive tangible business value. This alignment fosters collaboration, improves efficiency, and helps everyone work towards a common purpose.
Top 50 KPI metrics for Saas product teams
User Acquisition and Conversion:
User Acquisition and Conversion is a key performance indicator (KPI) that measures the effectiveness of a company’s efforts in attracting new users or customers and converting them into paying customers or active users.
- Total Website Visits: The total number of visits to your website.
- Unique Visitors: The number of individual visitors to your website.
- Traffic Sources: The breakdown of where your website traffic is coming from (e.g., organic search, referrals, direct).
- Conversion Rate: The percentage of website visitors who take a desired action, such as signing up for a trial or subscribing to your product. The conversion rate is typically calculated by dividing the number of conversions by the total number of visitors or interactions and multiplying by 100 to get a percentage.
- Trial Sign-ups: The number of users who sign up for a trial of your SaaS product.
- Trial-to-Paid Conversion Rate: The percentage of trial users who convert to paying customers. The Trial-to-Paid Conversion Rate can be calculated by dividing the number of customers who converted from a trial to a paid subscription by the total number of customers who started the trial.
- Churn Rate: The percentage of customers who cancel their subscription during a given period.
Product Engagement and Adoption
Product Engagement and Adoption is a key performance indicator (KPI) that measures the level of interaction and acceptance of a product or service by its intended users.
- Active Users: The number of users who interact with your product within a specific timeframe.
- Time Spent in App: The average time users spend actively using your SaaS product.
- Feature Usage: The usage metrics for specific features within your product.
- User Retention Rate: The percentage of customers who continue using your product over a given period.
- Customer Lifetime Value (CLTV): The average revenue generated by a customer throughout their relationship with your company.
- Monthly Recurring Revenue (MRR): The predictable and recurring revenue generated by your SaaS product every month.
- Annual Run Rate (ARR): The estimated annualized revenue based on your current MRR.
- Average Revenue Per User (ARPU): The average revenue generated per user or customer. To calculate Average Revenue Per User (ARPU), you can divide the total revenue generated by a business within a specific period by the total number of users or customers during that same period.
- Cost of Customer Acquisition (CAC): The average cost of acquiring a new customer, including marketing and sales expenses.
- Customer Lifetime Value to Cost of Customer Acquisition Ratio (CLTV: CAC): The ratio of CLTV to CAC, indicates the return on investment for acquiring new customers.
Customer Support and Satisfaction:
Customer Support and Satisfaction is a KPI metrics that measures the effectiveness and quality of a company’s customer support services, as well as the overall satisfaction level of its customers.
- Customer Satisfaction Score (CSAT): A measure of customer satisfaction based on surveys or feedback.
- Net Promoter Score (NPS): A metric that gauges customer loyalty and likelihood to recommend your product to others.
- Customer Support Response Time: The average time it takes for your support team to respond to customer inquiries.
- First Response Resolution Rate: The percentage of customer inquiries or issues resolved within the first response.
- Support Ticket Volume: The number of support tickets or inquiries received within a given period.
Product Performance and Stability:
Product Performance and Stability is a key performance indicator (KPI) that measures the effectiveness and reliability of a product or service over a specific period.
- Uptime and Availability: The percentage of time your product is available and accessible to users.
- Error Rate: The percentage of errors or failures encountered by users while using your product.
- Average Response Time: The average time it takes for your product to respond to user actions.
- Crash Rate: The percentage of instances where your product crashes or becomes unresponsive.
Sales and Conversion Performance:
Sales and Conversion Performance is a key performance indicator (KPI) that measures the effectiveness of a company’s sales and marketing efforts in generating revenue and converting prospects into customers.
- Sales Revenue: The total revenue generated from sales of your SaaS product.
- Sales Conversion Rate: The percentage of leads or prospects that convert to paying customers.
- Sales Pipeline Value: The total value of all potential deals in your sales pipeline.
- Average Deal Size: The average value of a closed deal.
- Sales Cycle Length: The average length of time it takes to close a deal from initial contact to conversion.
Market and Competitive Analysis:
Market and Competitive Analysis is a Key Performance Indicator (KPI) that measures the effectiveness of an organization’s efforts in understanding and evaluating its market environment and competition.
- Market Share: The percentage of the total market that your SaaS product occupies.
- Competitive Positioning: Your SaaS product’s position relative to your competitors in terms of features, pricing, and market perception.
- Customer Reviews and Ratings: The average rating and feedback from customers on review platforms.
- Market Growth Rate: The percentage rate at which the market for your SaaS product is growing.
Operational Efficiency and Scalability:
Operational Efficiency and Scalability is a Key Performance Indicator (KPI) that measures the effectiveness and capability of an organization or business in maximizing its operational processes and resources while adapting to changing demands and expanding its operations.
- Employee Productivity: The measure of individual or team output and efficiency.
- Support Tickets Per Employee: The average number of support tickets handled per employee.
- Infrastructure Costs: The total costs associated with hosting and maintaining your SaaS product infrastructure.
- Server Response Time: The average time it takes for your server to respond to requests.
User Satisfaction and Feedback:
User Satisfaction and Feedback is a key performance indicator (KPI) that measures the level of satisfaction and feedback provided by users or customers of a product, service, or experience.
- User Feedback Score: The average rating or score based on user feedback surveys.
- Feature Requests: The number of user requests for new features or improvements.
- Usability Score: The measure of how easy and intuitive your SaaS product is to use.
- Customer Effort Score (CES): A metric that quantifies the ease of the customer experience when using your product.
User Expansion and Upselling:
User Expansion and Upselling is a key performance indicator (KPIs) that measures the growth and profitability of a business
- Expansion Revenue: The additional revenue generated from existing customers through upselling or cross-selling.
- Expansion Rate: The percentage of customers who upgrade their subscription or purchase additional features.
- Upsell/Cross-sell Conversion Rate: The percentage of customers who convert on upsell or cross-sell offers.
Product Roadmap and Development:
Product Roadmap and Development is a key performance indicator (KPI) that measures the progress and effectiveness of a company’s product development initiatives.
- Feature Development Velocity: The speed at which new features or enhancements are developed and released.
- Bug Fix Rate: The average rate at which reported bugs or issues are resolved.
- Time to Market: The average time it takes to launch a new feature or version of your product.
- Customer Feedback Implementation: The percentage of customer feedback or feature requests that are implemented in your product.
How does OKR come into play and What are its benefits for SaaS product teams
OKR stands for Objectives and Key Results. It is a powerful goal-setting framework that helps organizations define and track their objectives and measure progress toward achieving them. The OKR methodology was popularized by companies like Google and has since been adopted by many organizations across various industries.
In the OKR framework, objectives are the ambitious and qualitative goals that an organization wants to achieve. Key results, on the other hand, are measurable and specific outcomes that define the progress toward those objectives. Key results should be measurable and quantifiable, typically with a numerical target or a specific outcome.
For SaaS product teams specifically, OKRs offer several benefits. They help establish clear goals and priorities, foster collaboration and focus, drive innovation and continuous improvement, and provide a framework for tracking and evaluating outcomes.
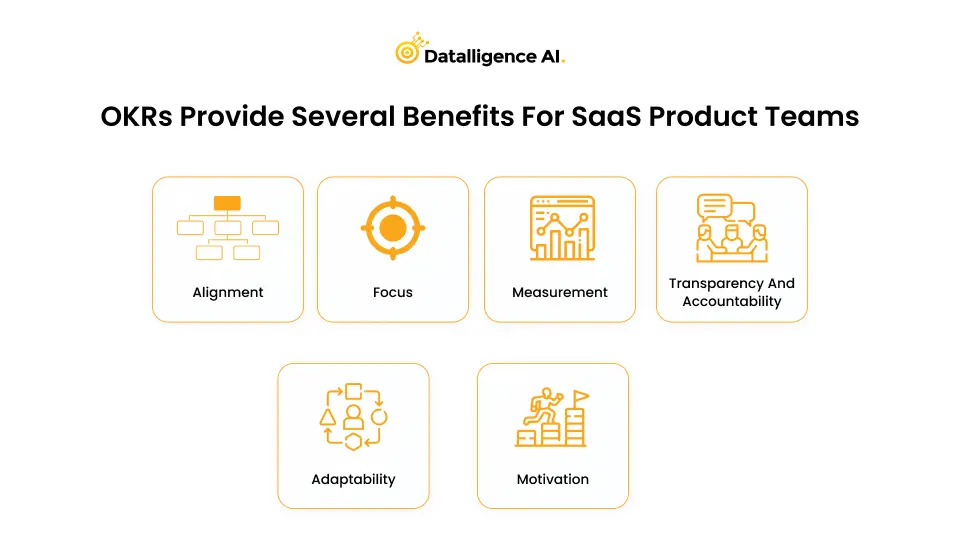
Alignment
OKRs help align the entire product team around common objectives, ensuring that everyone is working towards the same goals. It promotes a shared understanding of priorities and facilitates collaboration among team members.
Focus
By setting clear objectives, OKRs help product teams focus on what truly matters. It provides a framework for prioritization and ensures that efforts are directed toward the most impactful initiatives, reducing distractions and increasing productivity.
Measurement
Key results in OKRs provide a way to measure progress objectively. They enable product teams to track their performance, identify areas of improvement, and make data-driven decisions. Regularly reviewing key results helps teams stay on track and adjust their strategies as needed.
Transparency and accountability
OKRs are often transparent and visible to the entire organization. This promotes accountability and encourages individuals and teams to take ownership of their goals. It fosters a culture of transparency and collaboration, where progress and challenges are openly discussed.
Adaptability
OKRs are typically set for a specific time frame, such as a quarter or a year. This allows product teams to regularly reassess and adapt their goals based on changing circumstances, market conditions, or customer feedback. OKRs promote flexibility and agility in responding to evolving business needs.
Motivation
OKRs provide a clear sense of purpose and direction for product teams. By setting challenging yet achievable objectives, OKRs inspire and motivate team members to strive for excellence and stretch their capabilities. They create a sense of accomplishment when objectives are met, driving continuous improvement.
Which KPI Metrics Are Important for Product Teams?
It’s important to keep in mind that not all metrics used by product teams will apply to your product. By tracking specific metrics, product teams can gain insights into their performance, identify areas for improvement, and make data-driven decisions to drive the success of their products. While several KPIs are relevant for product teams, one metric stands out as particularly important.
Important KPI Metric for Product Teams:
- Customer Acquisition Cost (CAC)
- Customer Lifetime Value (CLTV)
- Net Promoter Score (NPS)
- Time to Market (TTM)
- Customer Satisfaction (CSAT)
- Return on Investment (ROI)
These KPI metrics play a vital role in evaluating the performance and effectiveness of product teams. By monitoring these metrics, product teams can track their progress, identify areas for improvement, and make data-driven decisions to enhance their products and achieve business goals.
Conclusion
Establishing KPI metrics and aligning them with objectives and key results (OKRs) is crucial for the success of SaaS product teams. By measuring what matters most, teams can track progress, make data-driven decisions, and drive overall growth and customer satisfaction.
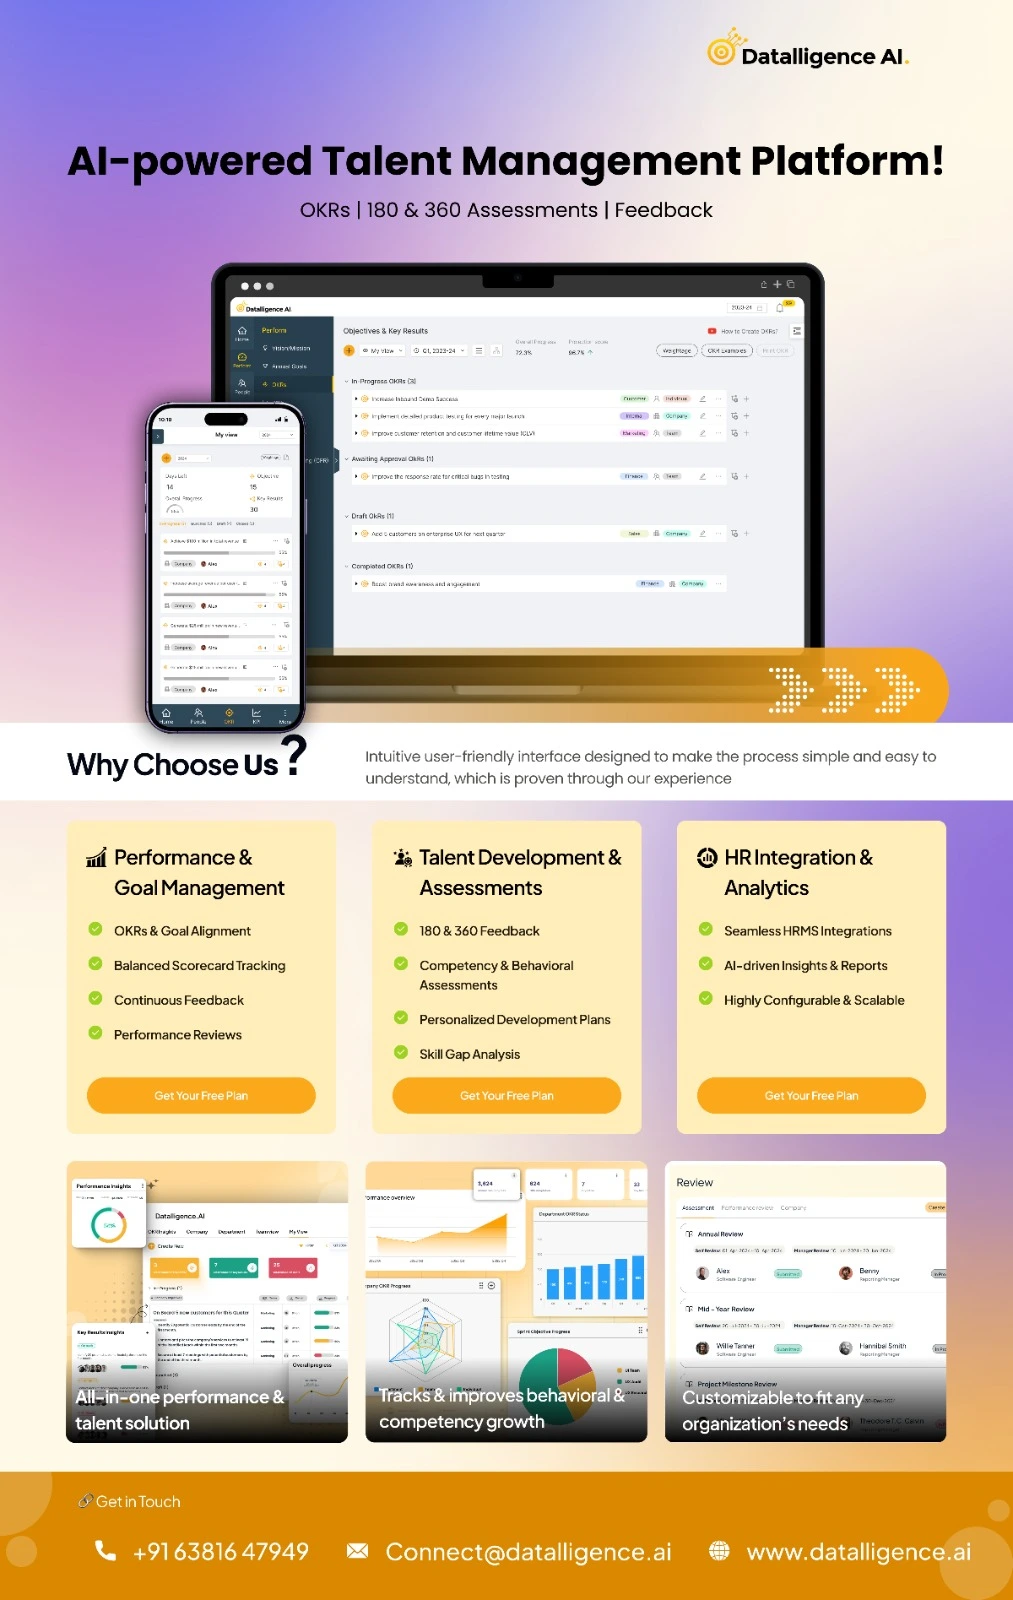
By leveraging Datalligence’s features, Saas product teams can streamline their KPI metrics tracking processes, foster collaboration, and make informed decisions to drive the success of their products and achieve their OKRs. Talk to our coaches and experts and gain more insights or try “Datalligence” for “free”.